

Monitoring servers with Prometheus, Node Exporter, Grafana and Alertmanager


Photo by Luke Chesser on Unsplash
Every organization wants its application and resources always up and running. For that, we must monitor our resources and applications. For a large organization where resources are the least in numbers, we can monitor manually, but in bigger organizations, it's a nightmare to monitor resources manually. Hopefully, we have a stack to rescue us from this. Today we will configure Prometheus, Grafana, and Alertmanager stack to make sure our resources and applications are running as expected. So let's begin with the introduction.
Grafana: Grafana is a data visualisation tool. It helps us to visualize data collected from the data source with the help of graphs, charts, tables, etc. Grafana supports multiple data sources like Prometheus, ELK, InfluxDB etc. Grafana also sends alerts when a resource crosses the specified threshold.
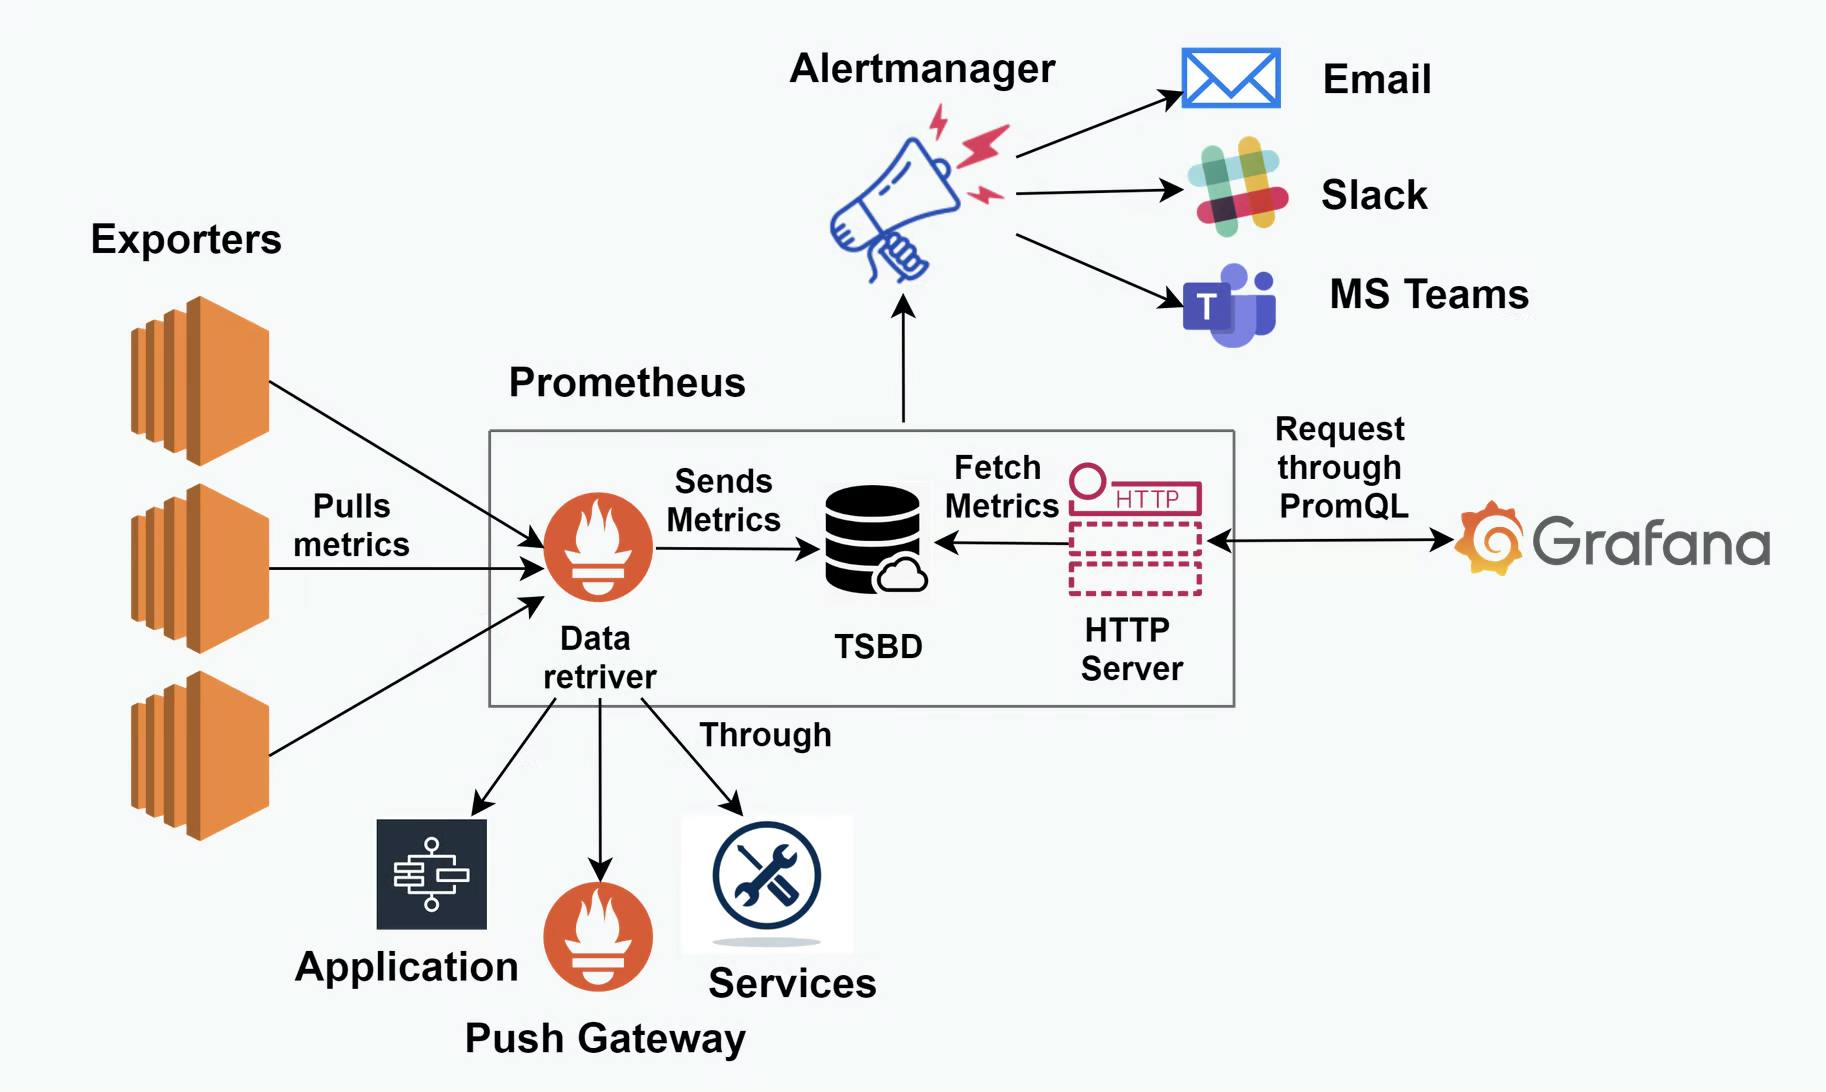
How do these tools work together to provide better monitoring?
1. Prometheus workers pull the metrics from the exporters, then they store the metrics in their own time-series database.
2. Visualisation tools request metrics from Prometheus and these tools request to the HTTP server through Prom query language, HTTP server fetches the metrics from the database and sends them back to the visualization tool.
3. If there is an alert happen, Prometheus pushes the alerts to the alert manager and alertmanager triggers the mail or a message to the respective owner specified in the configuration.
Node Exporter: Node exporter is a service with pulls server-level and OS-level metrics with a configurable metrics collector. It helps us in measuring various server resources such as RAM utilization, CPU utilization, Disk utilization, network monitoring, etc.
Node Exporter installation:
- Download Node Exporters from https://prometheus.io/download/
yum update -y
wget https://github.com/prometheus/node_exporter/releases/download/v1.7.0/node_exporter-1.7.0.linux-amd64.tar.gz
- Untar the downloaded file.
tar -xvf node_exporter-1.7.0.linux-amd64.tar.gz
- Copy node exporter binaries /usr/bin
cd node_exporter-1.7.0.linux-amd64
sudo cp node_exporter /usr/bin/
- Now we will create the node exporter user.
sudo useradd -rs /bin/false node_exporter
- The final step is to create the service file of the node exporter service.
sudo vim /etc/systemd/system/node-exporter.service
[Unit]
Description=Node Exporter
After=network.target

[Service]
User=node_exporter
Group=node_exporter
Type=simple
ExecStart=/usr/bin/node_exporter

[Install]
WantedBy=multi-user.target
Finally, we are all set to run node-exporter, just need to reload the daemon because we have added a new service file and start the node_exporter service.
sudo systemctl daemon-reload
sudo systemctl start node-exporter
sudo systemctl status node-exporter

As we see in the image our node-exporter service is Active. Now we will do the Prometheus installation.
Prometheus:
Prometheus is an open-source tool for monitoring our resources and applications. It collects metrics from the specified targets. It collects metrics by scraping metrics from HTTP endpoints on these targets. Prometheus stores metrics in its database(Time Series Database).
Components of Prometheus
Prometheus is divided into three parts:
1. Data Retrieval: Prometheus pulls the metrics from the targets with the help of a data retrieval service or worker. It pulls metrics from applications, services, and push gateways.
2. Time Series Database: Whatever the metrics pulled by the data retrieval, Prometheus stores the data in its own database (Time Series Database).
3. HTTP Server: These HTTP servers listen to the request by the visualization tools and give them the metrics to visualize on dashboards. These tools request metrics through PromQL (Prom Query Language).
Prometheus Installation:
1. Download Prometheus from https://prometheus.io/download/
wget https://github.com/prometheus/prometheus/releases/download/v2.48.0/prometheus-2.48.0.linux-amd64.tar.gz
- Untar the file
tar -xvf prometheus-2.48.0.linux-amd64.tar.gz
- Move the binaries to /usr/bin
cd prometheus-2.48.0.linux-amd64
sudo cp promtool prometheus /usr/bin
- Create Prometheus directory if not exist:
sudo mkdir /etc/prometheus
sudo mkdir /var/lib/prometheus
- Now we need to copy the configuration files to prometheus directory.
sudo cp -r console_libraries/ /etc/prometheus/
sudo cp -r consoles/ /etc/prometheus
- After installation we need to configure it, we need to specify the targets needs to monitor. Prometheus supports YAML language. Make sure indentation must be like showed in the below code.
sudo vim /etc/prometheus/prometheus.yml
global:
  scrape_interval: 10s

scrape_configs:
  - job_name: 'prometheus_metrics'
    static_configs:
      - targets: ['localhost:9090']

  - job_name: 'node_exporter_metrics'
    static_configs:
    - targets:
        - 127.0.0.1:9100 # you can give different IP address as well
- Now we need to create the prometheus user and change the ownership of the prometheus files.
sudo useradd -rs /bin/false prometheus
sudo chown -R prometheus: /etc/prometheus /var/lib/prometheus
- The last step is the create prometheus service file:
sudo vim /etc/systemd/system/prometheus.service
[Unit]
Description=Prometheus
After=network.target

[Service]
User=prometheus
Group=prometheus
Type=simple
ExecStart=/usr/bin/prometheus \
    --config.file /etc/prometheus/prometheus.yml \
    --storage.tsdb.path /var/lib/prometheus/ \
    --web.console.templates=/etc/prometheus/consoles \
    --web.console.libraries=/etc/prometheus/console_libraries

[Install]
WantedBy=multi-user.target
- Finally we are all set to run prometheus, just need to reload the daemon because we have added a new service file and start the prometheus service.
sudo systemctl daemon-reload
sudo systemctl start prometheus.service
sudo systemctl status prometheus.service

Now you can access the Prometheus web UI on http://<serverIP>:9090.

Alertmanager
Alertmanager is an open-source tool used to trigger alerts when resource usage is over the specified threshold. It handles the alert send by the client applications. It sends the alerts over Email, MS-Teams, slack and other platforms.
Alertmanager Installation:
- Download Alertmanager binaries.
wget https://github.com/prometheus/alertmanager/releases/download/v0.26.0/alertmanager-0.26.0.linux-amd64.tar.gz
- Untar alertmanager tar file.
tar -xvf alertmanager-0.26.0.linux-amd64.tar.gz
- Copy alertmanager binary to /usr/bin.
cd alertmanager-0.26.0.linux-amd64
sudo cp alertmanager /usr/bin
- Now we need to create the required configuration file for alertmanger.
sudo mkdir /etc/alertmanager
sudo vim /etc/alertmanager/alertmanager.yml
global:
route:
  # default route if none match
  receiver: alert-emailer

  group_by: ['alertname', 'priority']

receivers:
- name: alert-emailer
  email_configs:
  - to: 'receiver@example.com'
    send_resolved: false
    from: 'sender@example.com'
    smarthost: 'smtp.example.com:587'
    auth_username: 'sender@example.com'
    auth_password: 'Password'
    require_tls: true
- One more directory we need to create, because alertmanager stores its data in this file.
sudo mkdir /var/lib/alertmanager
- The final part is to make service file for alertmanager.
sudo vim /etc/systemd/system/alertmanager.service
[Unit]
Description=AlertManager Server Service
Wants=network-online.target
After=network-online.target

[Service]
User=root
Group=root
Type=simple
ExecStart=/usr/bin/alertmanager \
    --config.file=/etc/alertmanager/alertmanager.yml \
    --storage.path=/var/lib/alertmanager \
    --cluster.listen-address=localhost:9094
[Install]
WantedBy=multi-user.target
we are all set to run alertmanager service, just need to reload the daemon because we have added a new service file and start the prometheus service.
sudo systemctl daemon-reload
sudo systemctl start alertmanager.service
sudo systemctl status alertmanager.service

You can get the web UI of Alertmanger http://<serverIP>:9093.

Grafana
Grafana: Grafana is a data visualisation tool. It helps us to visualize data collected from the data source with the help of graphs, charts, tables, etc. Grafana supports multiple data sources like Prometheus, ELK, etc. Grafana also sends alerts when a resource crosses the specified threshold.
Grafana Installation
- To install the Grafana tool, we need to first configure the Grafana repo.
sudo vim /etc/yum.repos.d/grafana.repo
[grafana]
name=grafana
baseurl=https://packages.grafana.com/oss/rpm
repo_gpgcheck=1
enabled=1
gpgcheck=1
gpgkey=https://packages.grafana.com/gpg.key
sslverify=1
sslcacert=/etc/pki/tls/certs/ca-bundle.crt
- After creating the grafana repo. Now we can install the grafana package.
sudo yum install grafana
- Now Grafana is installed on our system. We need to start the service.
sudo systemctl daemon-reload
sudo systemctl start grafana-server.service
sudo systemctl status grafana-server.service
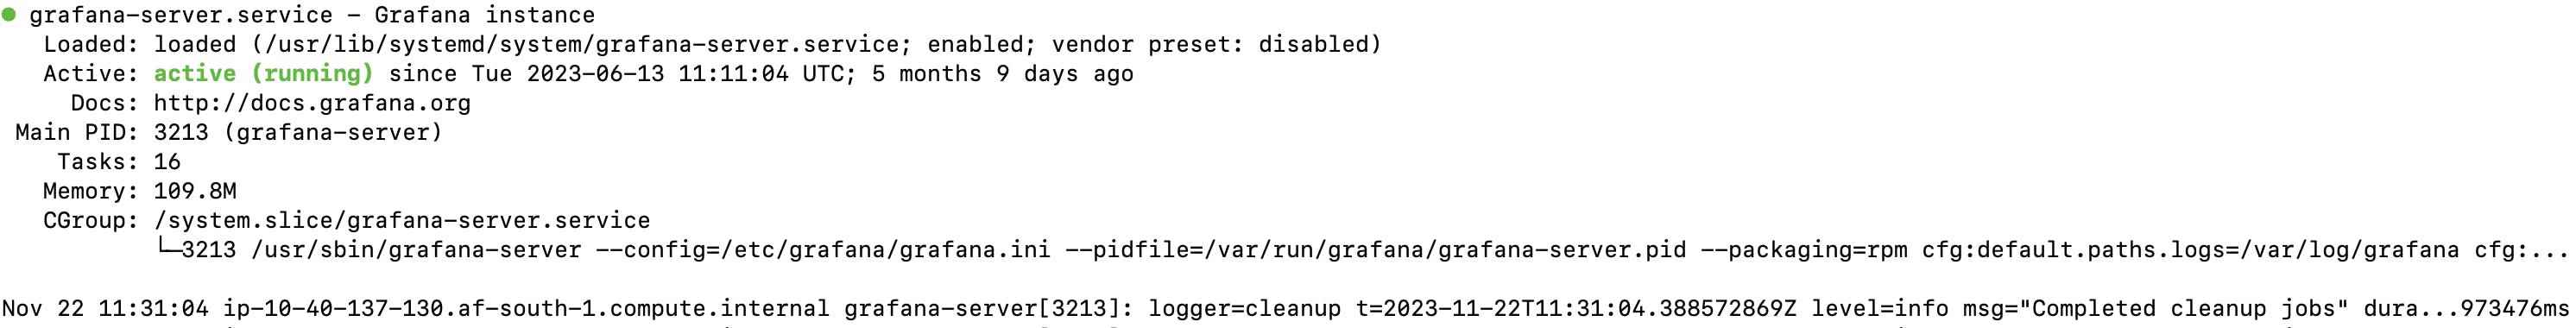
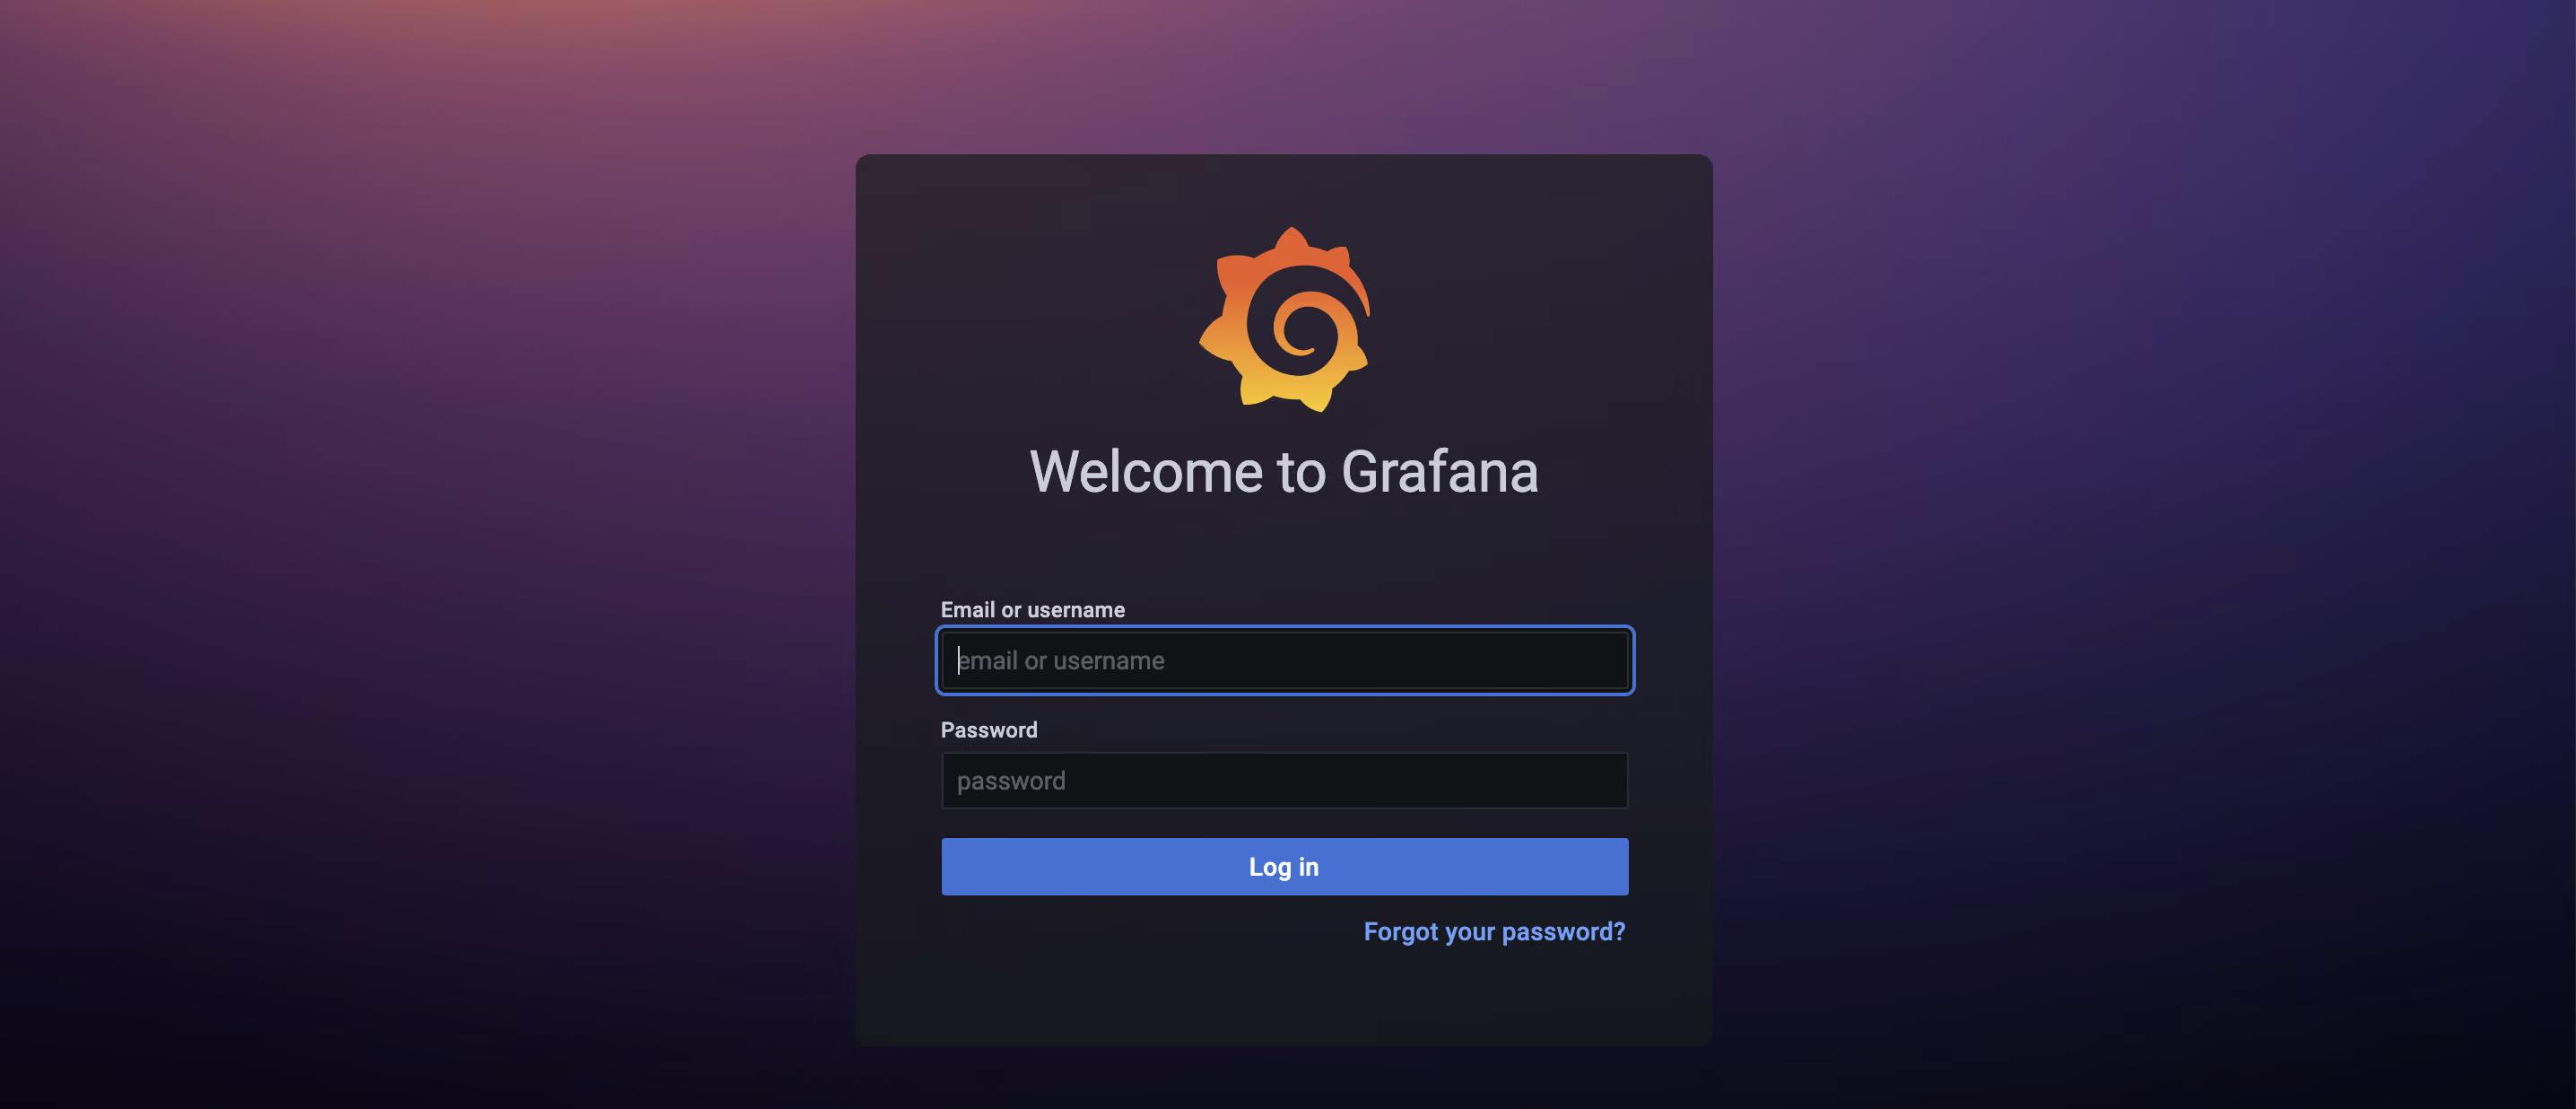
You can access the grafana web UI on http://<ServerIP>:3000.
Default Credentials:
Username = admin
Password = admin
We have completed the setup of our PGA stack, now you can create dashboards, apply alerts and monitor your infrastructure smoothly.
Thanks for reading this article, hope you have got something knowledgeable.